
01 Anthropic
Ivory, Editorial, Quiet
DASHBOARD.md · live sample · Tableau · Power BI · Korean and English
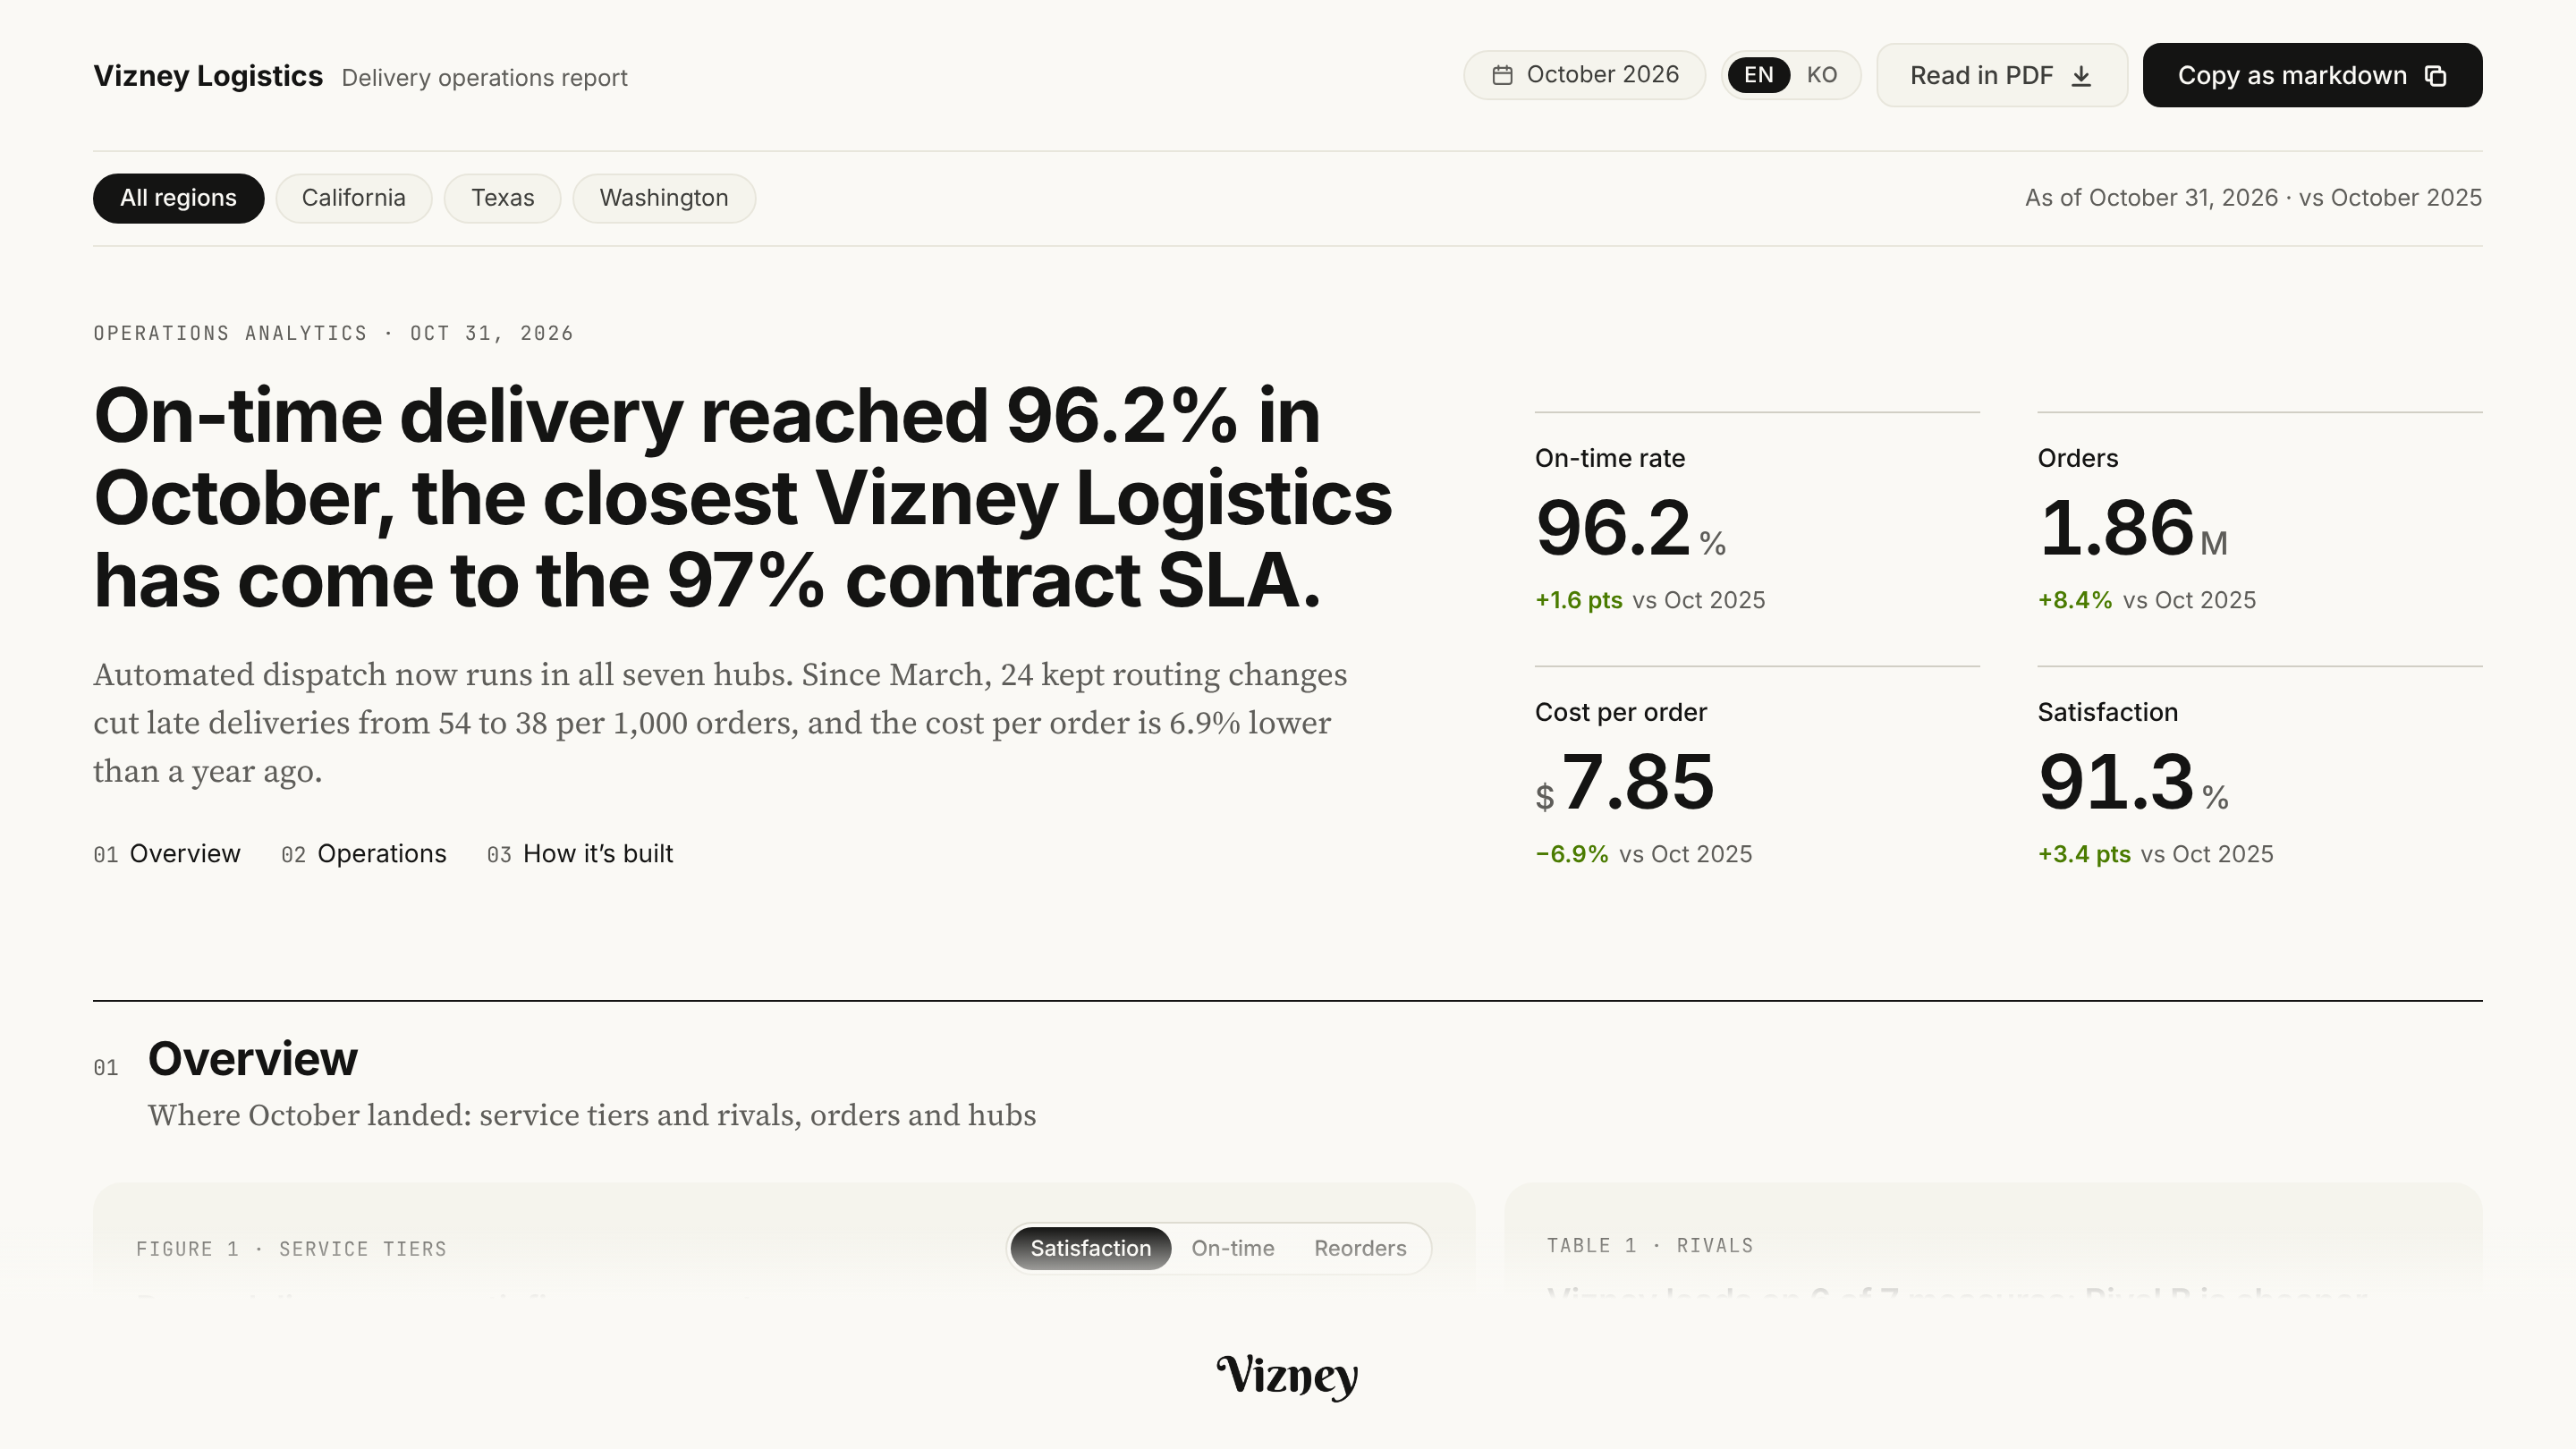
DESIGN.md tells a coding agent how your website looks. DASHBOARD.md adds what dashboards need: validated data colors, KPI cards, chart rules, number formats, density, and the settings for Tableau and Power BI. Each brand in the catalog is a worked example; your company's file is made the same way.
Put DASHBOARD.md in your repository root, then ask your agent for “a monthly sales dashboard in the Anthropic style defined in DASHBOARD.md”.
Each entry is a dashboard style read from a company's public website: a live sample with fictional data, DASHBOARD.md, and the Tableau, Power BI and CSS files. Reference readings only, not official designs, and not affiliated with or endorsed by the companies. Vote for the next one or request your own.
Ivory, Editorial, Quiet
Monochrome, Blocks, Tidy
The same package, from your brand guide and your data
A brand guide sets the logo, the brand colors and the typeface. A dashboard is where people compare numbers and read change, so it takes many more decisions, and an agent given only the brand guide gets them wrong. Compare two screens built from the same guide.
Colors and fonts onlyBrand red and orange fill the bars, so even rising sales read like a warning. The orange bars also lack contrast on white.
Designed as a styleRed stays in the logo and in bad changes. This year's bars are blue, and last year's step back in gray.
Colors and fonts onlyUp is green and down is red, so a falling cost ratio, which is good news, shows red, and a rising return rate shows green.
Designed as a styleColor says whether the change is good for that metric. A falling cost ratio is green and a rising return rate is red.
Colors and fonts onlyRaw figures like ₩1,243,512,800 overflow the card, and units as large as the digits leave each value at a different height.
Designed as a styleFigures are compacted to ₩1,244M with smaller units, and each card uses just two type sizes, one for the value and one for the rest.
Colors and fonts onlyFive tints of the brand colors fail the color-separation check, so readers keep going back to the legend.
Designed as a styleThree colors plus gray for Other, and only combinations that pass color-vision and contrast checks.
How cards fold, from wide monitors down to phones.
Number formats in both languages, and English labels that run longer, in one layout.
One filter row at the top that scopes every card, and no cards inside cards.
Rules for picking a chart, such as two aligned charts instead of a dual axis.
What a tooltip shows and in what order, and how holidays and events are marked.
Keyboard control, screen-reader tables and reduced motion.
A spec your coding agent reads from the repository root: tokens in the front matter, then colors, type, numbers, layout, components, charts, accessibility and tool mapping, compatible with the DESIGN.md convention.
Categorical, sequential and diverging palettes plus good and bad, every pair checked for color-vision deficiency, normal-vision separation and contrast.
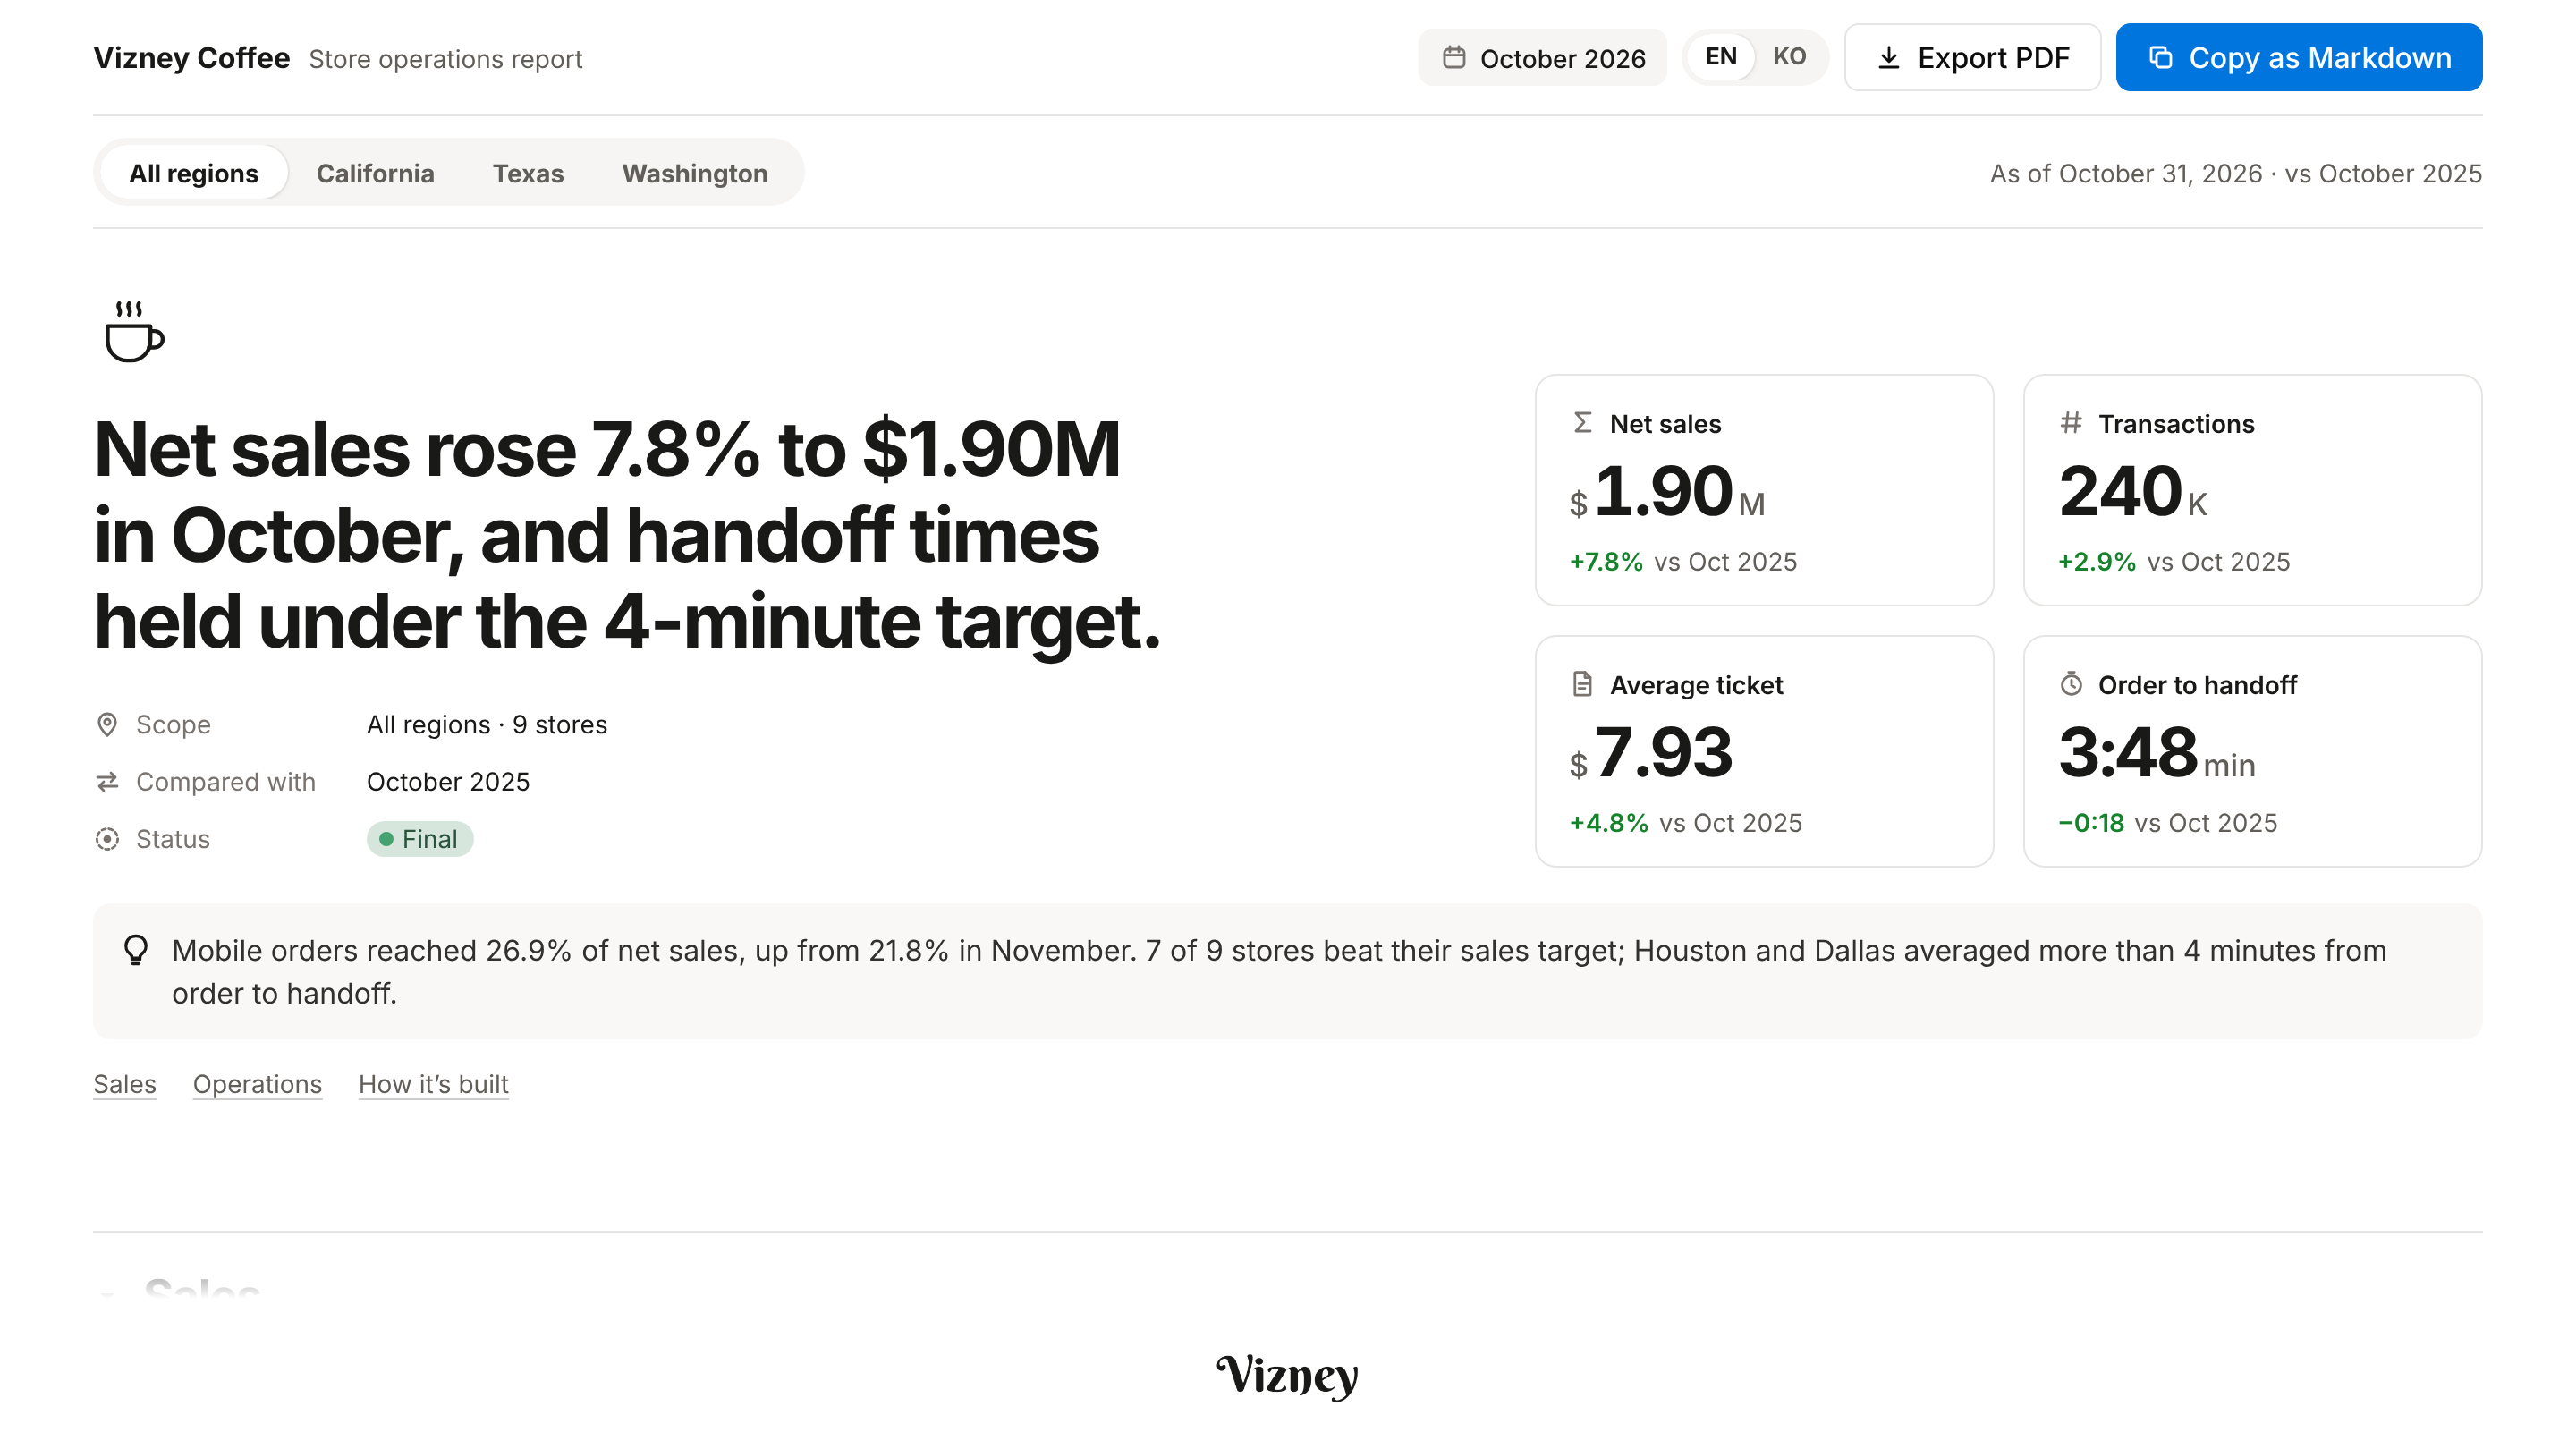
One real dashboard on a topic from your business, with fictional data, Korean and English in one file, laid out for every width, with tooltips, keyboard control and screen-reader tables.
A Tableau palette (.tps) with formatting notes, a Power BI theme (.json), CSS tokens, and a prompt pack for new builds, restyles and reviews.
Your website or brand guide, a few of the dashboards you use now, and the metrics you watch. A public website alone is enough to start.
We read the tokens, test whether the brand colors work as data colors, and note where your current numbers and charts mislead.
We settle the style on one live screen built from your business, and iterate with you on it.
DASHBOARD.md, the palettes, the Tableau and Power BI files and the prompts, in about a week. Private by default; published in the catalog only if you want it there.
Send your website or brand guide and a few screenshots of the dashboards you use now. Or request a public brand for the catalog on GitHub.
Contact us Request a brand ↗